Case Definitions
A case definition is the explicit rule for who counts as a case, and it is the spine of an outbreak investigation because every later number depends on it. Make it too narrow and real cases are missed; make it too broad and unrelated illness dilutes the signal. This page sets out what goes into a case definition, how it is graded and revised, the sensitivity-specificity trade-off it always involves, and how the 7-1-7 target puts a clock on the detection and response that a good definition makes possible. It is the companion to the field workflow in outbreak investigation, where the case definition is step four.
The elements of a case definition#
Two authoritative field guides describe a case definition in almost the same terms, and comparing them is the clearest way to see its parts.
The CDC Field Epidemiology Manual frames the definition as three elements that together specify a case:
- A condition — a set of symptoms (for example myalgia or headache), signs (fever, a maculopapular rash), or laboratory findings (a positive culture).
- Occurring during a particular time — the epidemic period.
- Occurring in one or more specific places or settings — a hospital, school, workplace, neighborhood, or a gathering such as a wedding.
The WHO Outbreak Toolkit lists the attributes as “person, time, and place, clinical and epidemiological criteria, as well as laboratory diagnosis.”
The two agree on the core — time, place, and clinical or laboratory criteria — and differ on one point worth naming lightly: where person sits. For the CDC, “time, place, and person” is the descriptive step that comes later (orienting the line list with epidemic curves and spot maps), not part of the definition itself; for the WHO, person is one of the defining attributes. It is a framing difference, not a contradiction.
One nuance the word “person” hides: the case unit is usually a person, but it need not be. In One Health, zoonotic, wildlife, or plant outbreaks the affected unit is an animal or plant host, as in the 2001 UK foot-and-mouth epidemic, where the case is a farm. So “person” generalizes to “the affected host or unit,” and in some definitions that axis carries little weight or is dropped.
Confirmed, probable, and suspected#
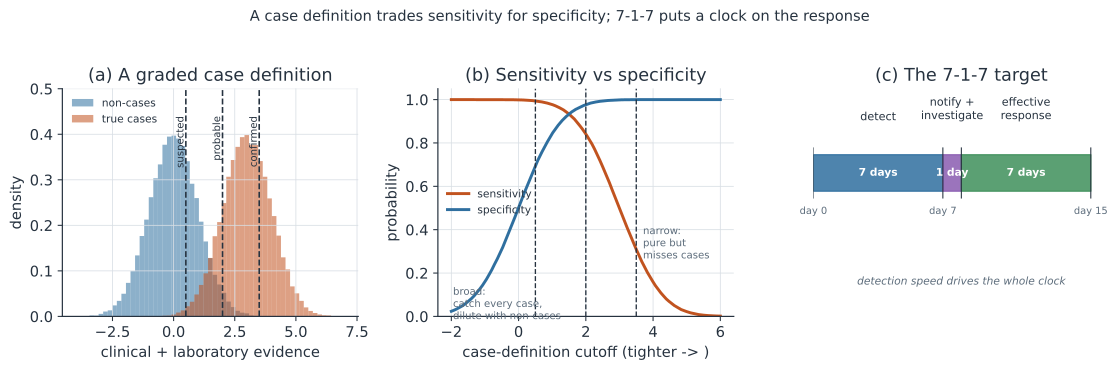
A case definition is usually graded into nested classes, from a broad clinical net to a narrow laboratory-verified core.
- Suspected — compatible symptoms only.
- Probable — typical illness plus an epidemiologic link.
- Confirmed — laboratory verification.
Grading lets an investigation move before laboratory results are complete: the field team can act on suspected and probable cases immediately while the confirmed count catches up, and because the classes are explicit the tallies stay auditable. The CDC’s own worked example, the 2007 Zika outbreak on Yap, shows how simple the clinical layer can be — a suspected case was “a patient with acute onset of generalized macular or papular rash, arthritis or arthralgia, or nonpurulent conjunctivitis during the period from April 1 through July 31, 2007” — with the laboratory criteria for confirmed versus probable layered on top.
Sensitivity versus specificity#
Every case definition is a threshold on a continuum of evidence, and moving that threshold trades two kinds of error against each other. A broad definition (the suspected end) has high sensitivity — it catches nearly every true case — but low specificity, so it also sweeps in non-cases and dilutes the count. A narrow definition (the confirmed end) has high specificity and a high positive predictive value — almost everyone it counts is a real case — but low sensitivity, so it misses many. The diagnostic-testing machinery of sensitivity, specificity, and predictive value is exactly the machinery of a case definition; panel (b) is the same trade-off drawn as the cutoff slides.
The practical rule is to maximize sensitivity early and optimize specificity later: begin broad so the search finds cases, then tighten as the picture sharpens. Per the WHO Toolkit, when the definition is refined every change should be evidence-based, communicated, and logged, so that a shift in the counting rule is never mistaken for a change in the epidemic. The same imperfect-classification problem echoes downstream: Bozzuto et al., 2020, Proc. R. Soc. B show that when infected and susceptible hosts can be told apart with only 50% sensitivity and specificity, a targeted control collapses into an untargeted one — a reminder that a fuzzy definition weakens every action built on it.
The definition shapes the epidemic curve#
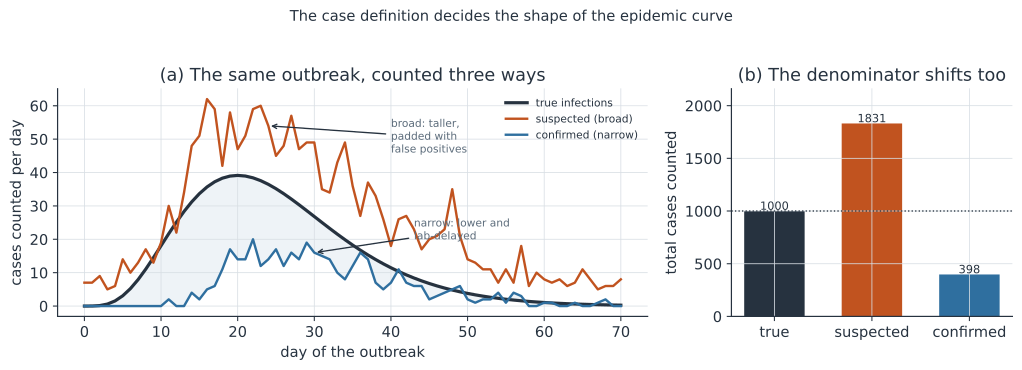
Because the case definition decides which illness is counted, it decides the shape of the epidemic curve itself. Count one true outbreak under a broad, suspected-level definition and the curve is taller and broader, padded with false positives from co-circulating look-alike illness; count the same outbreak under a narrow, confirmed-level definition and the curve is lower and shifted later, because laboratory confirmation both misses cases and takes time. The total count — the denominator behind every rate — moves the same way, so a change in the definition can masquerade as a change in the epidemic unless it is logged.
Finding cases without bias#
Once the definition exists, cases are counted by searching systematically across many sources — surveillance data, medical and laboratory records, institutional records, and special surveys — and recording each as a row in the line list. Casting a wide, consistent net guards against ascertainment bias, the distortion that creeps in when cases are found in one place more thoroughly than another. For foodborne outbreaks this search is highly standardized: USDA-FSIS Directive 8080.3 and the CDC National Hypothesis Generating Questionnaire turn exposure interviews into hypotheses and then into traceback, a concrete instance of definition, line list, and questionnaire working together.
Where the case definition sits#
The definition is one step in a longer investigation, and the CDC and WHO number the steps slightly differently but agree on the flow.
| CDC Field Epi Manual (10 steps) | WHO Outbreak Toolkit (phases) | |
|---|---|---|
| 1 | Prepare for field work | Prepare & Respond: confirm the outbreak and verify diagnosis; start generic control if possible; develop a case definition |
| 2 | Confirm the diagnosis | |
| 3 | Determine the existence of an outbreak | |
| 4 | Identify and count cases — the case definition lives here | Investigate & adapt: refine the case definition; find cases and contacts with standardized forms and a line list; descriptive epi by time, place, person; develop and test hypotheses; agent-specific control |
| 5 | Tabulate and orient by time, place, person | |
| 6 | Consider control measures now | |
| 7 | Develop and test hypotheses | |
| 8 | Plan systematic studies | |
| 9 | Implement and evaluate control | |
| 10 | Communicate findings | Communicate: messages with communities and authorities; disseminate findings |
The case definition anchors CDC step 4 and the WHO “develop then refine” thread; the person-place-time description is CDC step 5 and the WHO descriptive-epi stage. In practice the steps overlap and reorder — control can begin early — but the definition always comes before the counting it governs.
Putting a clock on the response: 7-1-7#
A case definition is what lets a health worker recognize a suspected outbreak in the first place, which is where timeliness begins. The 7-1-7 target of Frieden et al., 2021, Lancet makes that speed measurable: 7 days to detect a suspected outbreak, 1 day to notify public-health authorities and begin the investigation, and 7 days to mount an effective response (panel c). The response itself is broken into components — initiation, epidemiological investigation, laboratory confirmation, medical treatment, and, when needed, countermeasures, communications and community engagement, and coordination. The first “7” depends directly on this page: reaching it requires health workers trained on case definitions with the ability to detect suspected outbreaks, so a clear, well-graded definition is the front end of a timely response, and the speed and strength of control is the back end.
A worked example#
Imagine screening a group during an outbreak in which 30% are truly cases, each carrying an evidence score that runs higher for real cases than for non-cases. Sliding the case-definition cutoff from the suspected end to the confirmed end trades sensitivity for specificity in exactly the way the figure shows. A suspected-level cutoff catches almost every case but its positive predictive value is only about 0.6, so a third of what it counts are not cases; a confirmed-level cutoff is essentially pure but recovers only a minority of the true cases. The right choice depends on the question — find every possible case, or count only certain ones — and it is a choice the definition makes explicit.
In code#
We screen a synthetic outbreak population and evaluate three case-definition cutoffs by their sensitivity, specificity, count, and positive predictive value. The R and Julia versions mirror the Python.
R#
set.seed(717)
n <- 5000
is_case <- runif(n) < 0.30                          # 30% are truly cases
score <- ifelse(is_case, rnorm(n, 3, 1), rnorm(n, 0, 1))  # evidence score

evaluate <- function(cutoff) {
  flagged <- score >= cutoff
  tp <- sum(flagged & is_case); fp <- sum(flagged & !is_case)
  c(sens = tp / sum(is_case),
    spec = sum(!flagged & !is_case) / sum(!is_case),
    counted = sum(flagged),
    ppv = tp / sum(flagged))
}

for (d in list(c("suspected", 0.5), c("probable", 2.0), c("confirmed", 3.5))) {
  cat(sprintf("%-11s", d[[1]]), round(evaluate(as.numeric(d[[2]])), 2), "\n")
}
Python#
import numpy as np

rng = np.random.default_rng(717)
n = 5000
# Screened people during an outbreak: 30% are truly cases, each with an
# evidence score (non-cases ~N(0,1), true cases ~N(3,1)).
is_case = rng.random(n) < 0.30
score = np.where(is_case, rng.normal(3, 1, n), rng.normal(0, 1, n))

def evaluate(cutoff):
    flagged = score >= cutoff
    tp = (flagged & is_case).sum(); fp = (flagged & ~is_case).sum()
    sens = tp / is_case.sum()
    spec = (~flagged & ~is_case).sum() / (~is_case).sum()
    ppv = tp / flagged.sum() if flagged.sum() else float("nan")
    return sens, spec, flagged.sum(), ppv

print(f"{'definition':11s}{'cutoff':>7s}{'sens':>7s}{'spec':>7s}"
      f"{'counted':>9s}{'PPV':>7s}")
for name, c in [("suspected", 0.5), ("probable", 2.0), ("confirmed", 3.5)]:
    sens, spec, cnt, ppv = evaluate(c)
    print(f"{name:11s}{c:7.1f}{sens:7.2f}{spec:7.2f}{cnt:9d}{ppv:7.2f}")
print(f"(true cases in the screened group: {is_case.sum()})")
definition  cutoff   sens   spec  counted    PPV
suspected      0.5   0.99   0.71     2564   0.61
probable       2.0   0.83   0.98     1383   0.94
confirmed      3.5   0.28   1.00      443   1.00
(true cases in the screened group: 1562)
Julia#
using Random, Statistics
Random.seed!(717)
n = 5000
is_case = rand(n) .< 0.30                             # 30% are truly cases
score = [c ? 3 + randn() : randn() for c in is_case]  # evidence score

function evaluate(cutoff)
    flagged = score .>= cutoff
    tp = sum(flagged .& is_case)
    sens = tp / sum(is_case)
    spec = sum(.!flagged .& .!is_case) / sum(.!is_case)
    ppv = tp / sum(flagged)
    (sens = sens, spec = spec, counted = sum(flagged), ppv = ppv)
end

for (name, c) in [("suspected", 0.5), ("probable", 2.0), ("confirmed", 3.5)]
    println(rpad(name, 11), evaluate(c))
end
Why it matters#
The case definition is the quiet decision that fixes what every later figure means. It decides how many cases there are, which is to say it decides the shape of the epidemic curve, the size of the denominator, and the apparent effect of any control. Getting it right is not about perfection but about being explicit — choosing where on the sensitivity-specificity curve to stand, grading the classes so work can start before certainty arrives, and logging every change so the count stays honest. That explicitness is what turns a room full of sick people into numbers an investigation can reason about, and what a timely 7-1-7 response is built on.