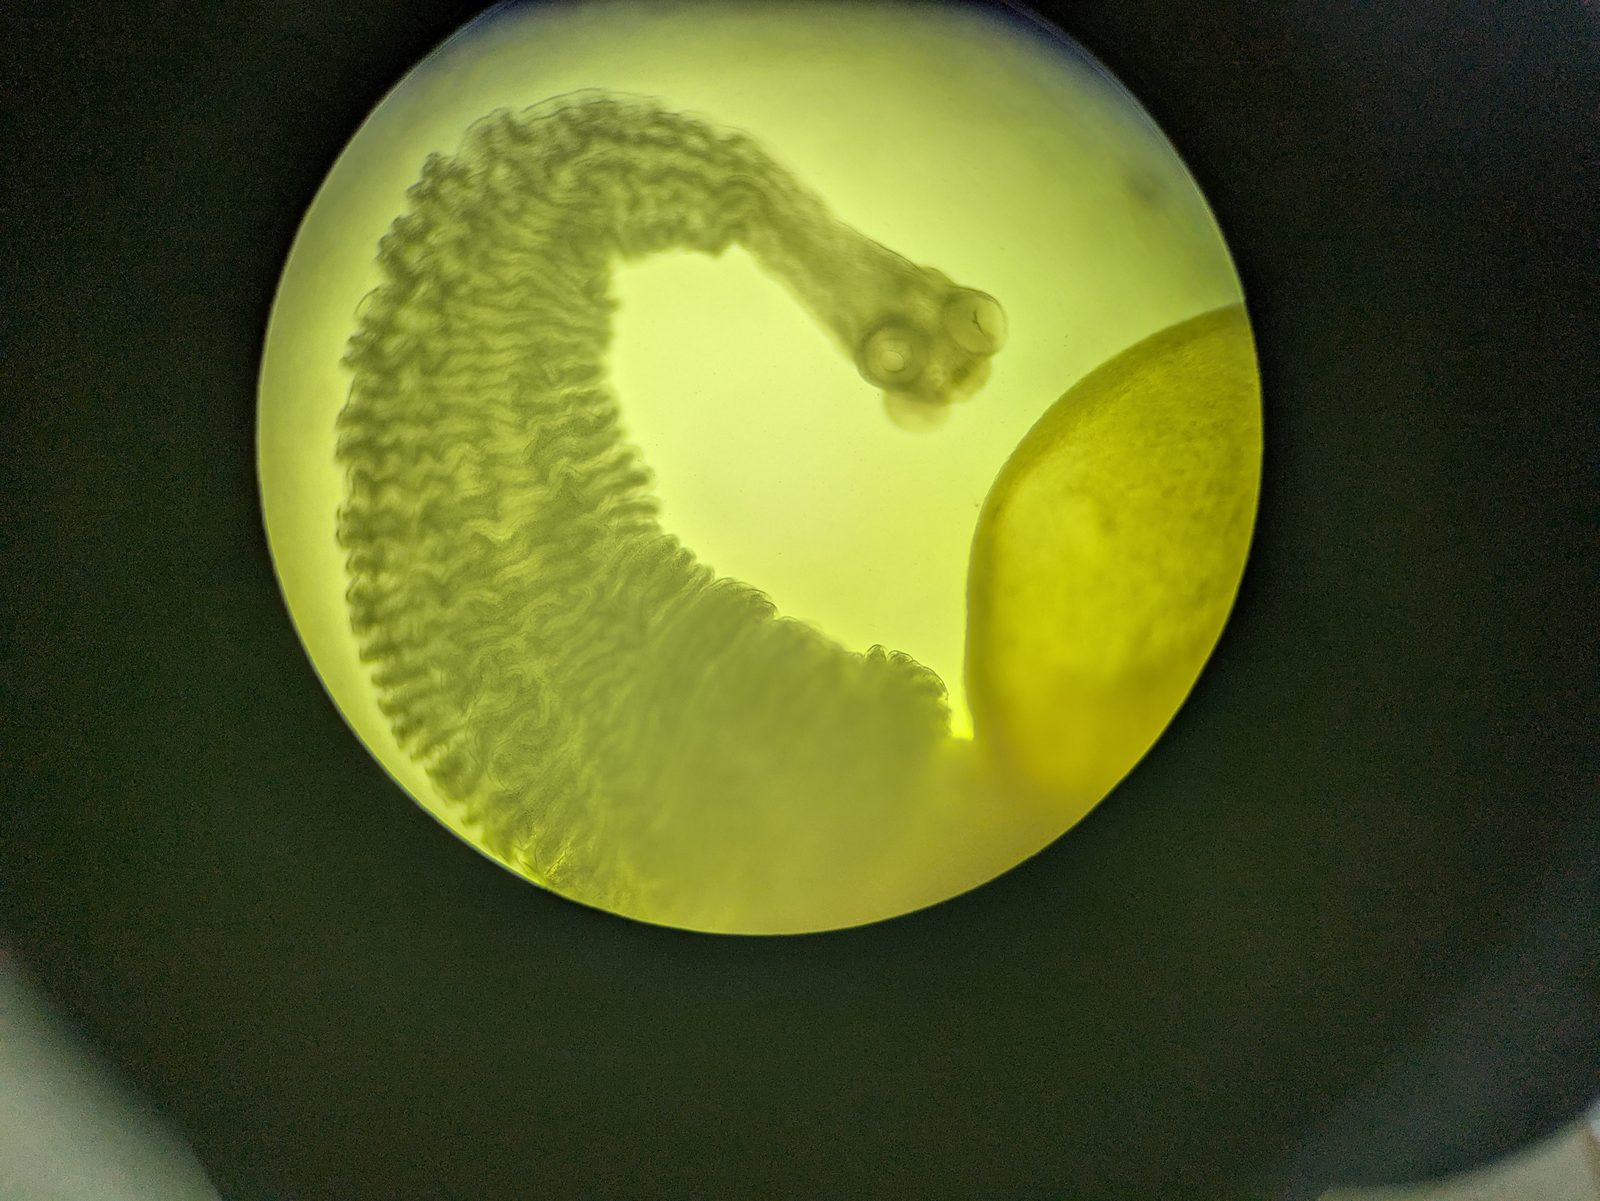
Diagnostics & Surveillance
Every case count, every prevalence estimate, and every genomic tree starts with a laboratory test that says “this sample contains this pathogen.” The methods differ in what they detect, how fast, how cheaply, and with what infrastructure — and no single assay wins on every axis. This collection walks through the workhorse techniques of infectious-disease diagnostics and the trade-offs that decide which one belongs in a reference lab, a clinic, or a field tent.
What each method detects#
A diagnostic can target any layer of the pathogen or the host’s response to it, and the target sets both the timing of detection and the meaning of a positive.
- Nucleic acid (the pathogen’s RNA/DNA) — qPCR, LAMP. Most sensitive and specific; positive early, during active infection.
- Antigen (pathogen proteins) — rapid antigen tests, antigen-capture ELISA. Fast and cheap; positive only when pathogen load is high.
- Antibody (the host’s immune response) — ELISA, Western blot. Positive after seroconversion; the basis of serosurveillance and evidence of past exposure.
- Whole organism — culture and Gram stain, microscopy. Direct growth or visualization; still the reference standard for many bacteria and parasites.
- Molecular fingerprint — MALDI-TOF mass spectrometry, electron microscopy. Identifies an organism from its protein spectrum or its ultrastructure.
The diagnostic window#
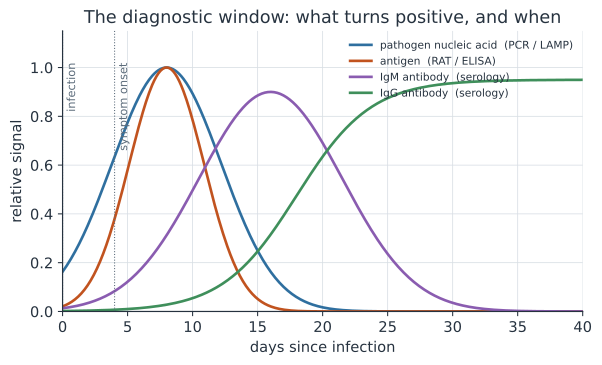
The figure above is the single most useful idea in the field: timing determines which test is positive. Nucleic acid and antigen appear first, tracking active infection, then fade. Antibodies (IgM, then IgG) appear only after the immune system responds, so a serological test taken too early is falsely negative, while a PCR taken weeks after recovery can be falsely negative even though the person was truly infected. This is why case definitions often pair a molecular confirmatory test for acute infection with serology for past exposure.
Trade-offs: no assay wins on every axis#
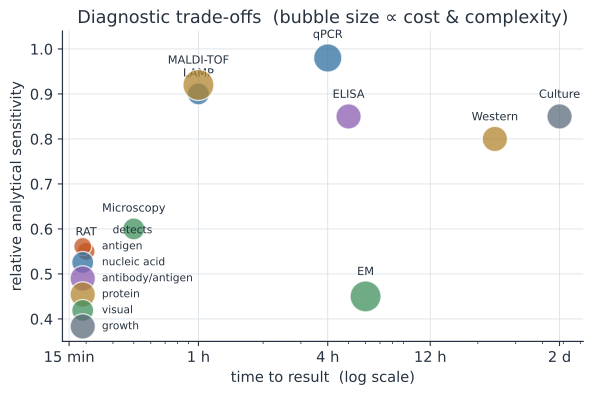
Choosing a diagnostic is an exercise in constrained optimization across sensitivity, specificity, speed, cost, and the infrastructure and training a method demands.
| Method | Detects | Sensitivity | Specificity | Turnaround | Cost / complexity | Key resource constraint |
|---|---|---|---|---|---|---|
| qPCR | nucleic acid | very high | very high | hours | high (thermocycler, cold chain) | reagents, trained staff, power |
| LAMP | nucleic acid | high | high | ~30–60 min | low–moderate | primer design; contamination control |
| ELISA | antigen / antibody | moderate–high | high | hours | moderate (plate reader) | antibody reagents, batch controls |
| Rapid antigen test | antigen | low–moderate | high | ~15 min | very low | none — point-of-care |
| Culture & Gram stain | live organism | high | high | 1–5 days | moderate | viable sample, biosafety, skilled tech |
| Microscopy | organism / cells | variable | moderate–high | minutes | low | expert microscopist |
| SDS-PAGE / Western | specific protein | moderate | very high | hours–1 day | moderate | antibodies, technical skill |
| MALDI-TOF | protein fingerprint | high | high | minutes (post-culture) | high capital, low per-test | ~US$150–250k instrument; a culture first |
| Electron microscopy | ultrastructure | low | moderate | hours | very high | ~US$0.5–2M instrument, expert operator |
Two lessons recur across the pages that follow.
- Sensitivity and specificity are not fixed properties of an assay — they depend on the sampling timing (the diagnostic window), the specimen quality, and the prevalence in the tested population, which drives the positive predictive value.
- The best test on paper is often the wrong test in practice. A PCR assay with 99% sensitivity is useless without cold chain, stable power, reagent supply, and trained technologists; a rapid test with 60% sensitivity that returns a result in fifteen minutes at the bedside may avert far more transmission.
From diagnosis to surveillance#
Individual tests aggregate into surveillance — the systematic monitoring that tells us where and how fast a pathogen is spreading.
- Screening vs confirmatory testing — cheap, fast, sensitive tests screen broadly; specific tests confirm positives, a two-tier strategy that manages the false-positive burden at low prevalence.
- Pooled testing — combining specimens multiplies throughput when prevalence is low, at some cost in sensitivity; estimating prevalence from the pools takes dedicated methods.
- Wastewater surveillance — qPCR or sequencing of sewage tracks community transmission without testing individuals.
- Genomic surveillance — sequencing positives reveals variants and reconstructs transmission (see the molecular clock and phylodynamics).
Methods#
- qPCR and RT-qPCR — amplification, Ct values, standard curves, and efficiency
- LAMP: Isothermal Amplification — point-of-care molecular testing without a thermocycler
- ELISA — plate immunoassays and the four-parameter logistic curve
- Rapid Antigen & Lateral-Flow Tests — bedside antigen detection and its prevalence dependence
- Culture and the Gram Stain — growing and classifying bacteria, and susceptibility testing
- Diagnostic Microscopy and Parasitology — blood films, stains, and crystal analysis
- SDS-PAGE and Western Blotting — separating proteins and confirmatory serology
- MALDI-TOF Mass Spectrometry — identifying microbes by their protein fingerprint
- Electron Microscopy — visualizing virions and ultrastructure
Related#
- Detection Probability: Viral Kinetics and Assay Thresholds — the quantitative link between viral load, the limit of detection, and time-varying sensitivity
- Dilutions, Titers, and Standard Curves — serial-dilution titers and reading an unknown off an ELISA standard curve
- Diagnostic Testing and Screening — sensitivity, specificity, PPV, and ROC
- Diagnostic Test Accuracy Meta-Analysis — pooling sensitivity and specificity across studies (bivariate/HSROC)
- Data Ingestion & APIs — pulling sequence data from GenBank and GISAID
- The Molecular Clock and Phylodynamics
- Epidemiology