Adaptive Dynamics
Adaptive dynamics asks where a continuous trait — a pathogen’s transmission rate, a host’s defense investment, a body size — will settle under natural selection. The idea is to test, for every possible resident population, whether a slightly different rare mutant can invade. Following the sequence of successful invasions traces the trait to its long-term evolutionary endpoints and reveals whether those endpoints are stable or split a population in two.
Invasion fitness#
Fix a resident population with trait at its ecological equilibrium. Introduce a rare mutant with trait and ask whether it grows. Its long-term per-capita growth rate in the environment set by the resident is the invasion fitness . A mutant spreads when and dies out when , and by construction a resident cannot invade itself, so always. Evolution proceeds as a succession of invasions by nearby mutants, each replacing the resident and shifting the trait a small step.
The selection gradient and singular strategies#
Near the resident the direction of change is set by the slope of invasion fitness in the mutant trait, the selection gradient
Where selection pushes the trait up; where it pushes down. A trait value where the gradient vanishes,
is an evolutionarily singular strategy — a candidate endpoint where directional selection stops. What happens at depends on two independent second-order properties.
Evolutionary versus convergence stability#
Two distinct questions must both be asked at a singular point.
Evolutionary stability (ESS). Can any nearby mutant invade once the population sits at ? If invasion fitness has a maximum in at ,
then no neighbor invades and is uninvadable.
Convergence stability. Does the succession of invasions actually lead toward from nearby residents? This holds when the selection gradient decreases through the singular point,
The two properties are logically separate. A singular strategy that is both convergence stable and evolutionarily stable is a continuously stable strategy (CSS): selection carries the trait to and holds it there. A point that is convergence stable but not evolutionarily stable is an evolutionary branching point — the population is drawn to , but once there it experiences disruptive selection, splits, and diversifies into two coexisting strains.
The pairwise invasibility plot#
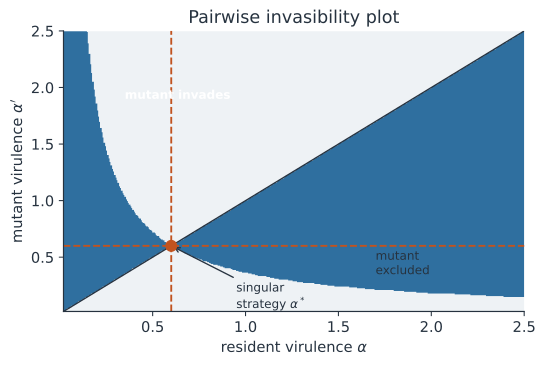
The pairwise invasibility plot (PIP) shows the sign of over the plane of resident against mutant . The diagonal is always neutral. A singular strategy sits where the boundary between the invasion and exclusion regions crosses the diagonal, and the local pattern of the shaded regions around that crossing reads off its stability: whether the vertical strip above lies inside or outside the invasion region distinguishes a CSS from a branching point.
A worked example#
Take the transmission-virulence trade-off from the evolution of virulence. An infection with virulence transmits at and clears at total rate , so its reproduction number is
A rare mutant strain invades the resident’s disease-free host environment exactly when its own exceeds the resident’s, so invasion fitness has the sign of and the singular strategy maximizes . Setting with gives , so
Because has a single interior maximum, its second derivative at is negative, so is both evolutionarily stable and convergence stable — a CSS at , with no branching. With and the optimum is .
In code#
R#
gamma <- 0.5; mu <- 0.1; a <- 3
R0 <- function(al) a * sqrt(al) / (gamma + al + mu)

grad <- function(x, h = 1e-6) (R0(x + h) - R0(x - h)) / (2 * h)
x_star <- uniroot(grad, c(0.05, 5))$root   # selection gradient = 0

d2 <- function(x, h = 1e-4) (R0(x + h) - 2 * R0(x) + R0(x - h)) / h^2
c(x_star = x_star, ess = d2(x_star) < 0)   # ~0.6, TRUE (uninvadable)
Python#
import numpy as np
from scipy.optimize import brentq

gamma, mu, a = 0.5, 0.1, 3.0


def R0(al):
    return a * np.sqrt(al) / (gamma + al + mu)


def grad(x, h=1e-6):
    """Selection gradient: slope of invasion fitness at y = x."""
    return (R0(x + h) - R0(x - h)) / (2 * h)


x_star = brentq(grad, 0.05, 5.0)   # singular strategy where gradient vanishes


def curv(x, h=1e-4):
    return (R0(x + h) - 2 * R0(x) + R0(x - h)) / h**2


def dgrad(x, h=1e-3):
    return (grad(x + h) - grad(x - h)) / (2 * h)


ess = curv(x_star) < 0             # fitness maximum: uninvadable
conv = dgrad(x_star) < 0           # gradient decreasing: attracting
kind = "CSS" if ess and conv else "branching point" if conv else "repellor"

print(f"singular strategy alpha* = {x_star:.4f}")
print(f"analytic gamma + mu      = {gamma + mu:.4f}")
print(f"evolutionarily stable    = {ess}")
print(f"convergence stable       = {conv}")
print(f"classification           = {kind}")
singular strategy alpha* = 0.6000
analytic gamma + mu      = 0.6000
evolutionarily stable    = True
convergence stable       = True
classification           = CSS
Julia#
using Roots

γ, μ, a = 0.5, 0.1, 3.0
R0(α) = a * sqrt(α) / (γ + α + μ)

grad(x; h = 1e-6) = (R0(x + h) - R0(x - h)) / (2h)
x_star = find_zero(grad, (0.05, 5.0))            # singular strategy

curv(x; h = 1e-4) = (R0(x + h) - 2R0(x) + R0(x - h)) / h^2
ess = curv(x_star) < 0                           # uninvadable
println("alpha* = ", round(x_star, digits = 4), "  ESS = ", ess)
CSS versus branching in the plot#
The virulence example maximizes , so its singular strategy is always a CSS and never branches. To see branching in a pairwise invasibility plot we need frequency-dependent selection, where invasion fitness depends on the resident and not just on a fixed optimum. The standard example is Gaussian resource competition (Geritz et al., 1998): a trait draws on resources with abundance , and a mutant competes with the resident through the kernel . A rare mutant in a resident at carrying capacity has invasion fitness
with a singular strategy at . The same second-order test separates the two outcomes: is a CSS when the competition kernel is wider than the resource distribution () and an evolutionary branching point when it is narrower ().
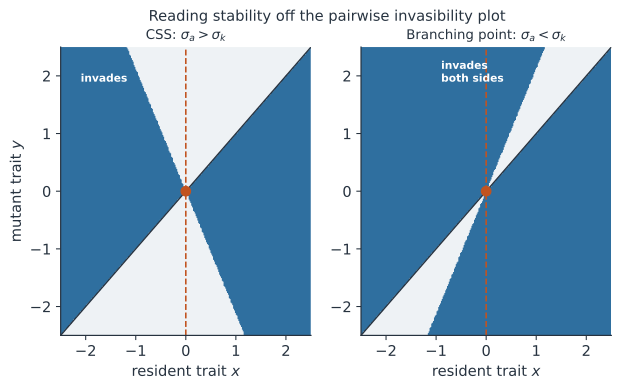
The two plots differ only in the width ratio. Reading up the vertical line through tells the story: for the CSS the strip sits in the exclusion region and the resident holds, while at the branching point the strip sits inside the invasion region, so disruptive selection splits the population into two coexisting strains.
Python#
import numpy as np


def invasion_sign(sigma_a, sigma_k, grid):
    """1 where a rare mutant y invades resident x, else 0, over the plane."""
    X, Y = np.meshgrid(grid, grid)          # X: resident, Y: mutant
    K = lambda z: np.exp(-z**2 / (2 * sigma_k**2))
    a = np.exp(-(X - Y)**2 / (2 * sigma_a**2))
    return (1.0 - a * K(X) / K(Y) > 0).astype(float)


grid = np.linspace(-2.5, 2.5, 400)
css = invasion_sign(sigma_a=1.0, sigma_k=0.6, grid=grid)   # sigma_a > sigma_k
branch = invasion_sign(sigma_a=0.6, sigma_k=1.0, grid=grid)  # sigma_a < sigma_k

# At the singular strategy x* = 0, does a nearby mutant invade?
j = np.argmin(np.abs(grid))                 # column nearest x* = 0
near = np.argmin(np.abs(grid - 0.3))        # a mutant just above x*
print(f"CSS: mutant invades x* = {bool(css[near, j])}")
print(f"branching: mutant invades x* = {bool(branch[near, j])}")

# Plot with imshow(css/branch, origin='lower', extent=[-2.5, 2.5, -2.5, 2.5]).
CSS: mutant invades x* = False
branching: mutant invades x* = True
R#
invasion_sign <- function(sigma_a, sigma_k, grid) {
  X <- outer(grid, grid, function(x, y) x)   # resident varies down columns
  Y <- outer(grid, grid, function(x, y) y)   # mutant varies across rows
  K <- function(z) exp(-z^2 / (2 * sigma_k^2))
  a <- exp(-(X - Y)^2 / (2 * sigma_a^2))
  (1 - a * K(X) / K(Y)) > 0                   # TRUE where the mutant invades
}

grid   <- seq(-2.5, 2.5, length.out = 400)
css    <- invasion_sign(1.0, 0.6, grid)       # sigma_a > sigma_k -> CSS
branch <- invasion_sign(0.6, 1.0, grid)       # sigma_a < sigma_k -> branching
image(grid, grid, t(branch), xlab = "resident x", ylab = "mutant y")
Julia#
function invasion_sign(σ_a, σ_k, grid)
    K(z) = exp(-z^2 / (2σ_k^2))
    [1 - exp(-(x - y)^2 / (2σ_a^2)) * K(x) / K(y) > 0
     for y in grid, x in grid]               # rows: mutant y, cols: resident x
end

grid   = range(-2.5, 2.5, length = 400)
css    = invasion_sign(1.0, 0.6, grid)        # σ_a > σ_k -> CSS
branch = invasion_sign(0.6, 1.0, grid)        # σ_a < σ_k -> branching
# heatmap(grid, grid, branch) with Makie or Plots to draw the PIP.
Why it matters#
Adaptive dynamics gives infectious-disease evolution a common language for continuous traits: virulence, drug resistance, host range, and antigenic escape are all traits under invasion selection. Its central warning is that being attracting and being uninvadable are separate properties, so a trait can evolve toward a value where selection then turns disruptive and the pathogen population diversifies — the branching-point route to coexisting strains. The same invasion-fitness logic connects to evolutionary game theory, the evolution of cooperation, and the Price equation, and it frames the treatment problem taken up in resistance evolution.