Superspreading and Transmission Heterogeneity
The reproduction number is an average, and averages hide the thing that often matters most. Two pathogens can share the same yet behave completely differently: one where nearly every case infects one or two others, and one where most cases infect no one while a rare few ignite explosive clusters. That second pattern is superspreading, and it is the rule rather than the exception for respiratory and directly transmitted pathogens. Capturing it means describing not just the mean of transmission but its whole distribution.
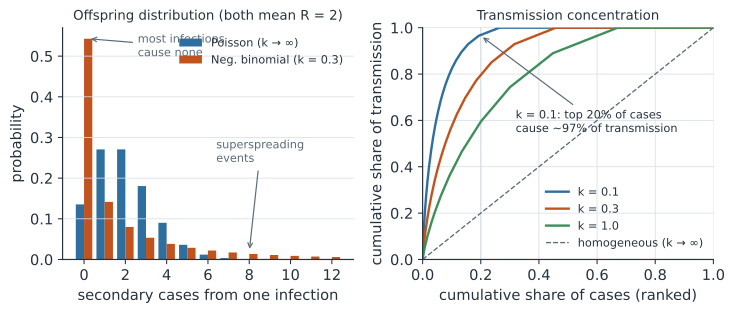
The individual reproduction number#
Define the individual reproduction number as the number of people a given infected person actually goes on to infect. Across a population is a random variable whose mean is , but whose spread is a property of the pathogen and its social context in its own right. The distribution of is the offspring distribution, and it is the same object that drives a branching process: each case seeds the next generation by drawing from it.
If everyone were identical and contacts were random, would be Poisson with mean , so its variance would also equal . Real transmission is far more variable than that. A handful of people, settings, and moments — a crowded indoor event, a peak-shedding day, a highly connected individual — produce many secondary cases, while most infections produce none.
The dispersion parameter k#
The standard way to capture this over-dispersion is to model as a negative binomial distribution with mean and dispersion parameter (Lloyd-Smith et al. 2005, doi:10.1038/nature04153). The variance is then
so small means high variance and strong heterogeneity. As the negative binomial collapses back to the Poisson (homogeneous mixing); at it is geometric; and as transmission becomes extremely concentrated. Estimates cluster low for the pathogens we worry about: for SARS-CoV-2 and around for SARS-CoV-1, against for pandemic influenza, which spreads far more evenly.
A useful consequence: the probability that an infected person transmits to no one is the negative binomial mass at zero,
which for and is about . Three in four cases are dead ends, and the epidemic is carried by the minority who are not.
The 20/80 rule#
Because a few cases do most of the work, the cumulative share of transmission rises steeply against the ranked share of cases. The classic heuristic is the 20/80 rule, that about 20% of cases account for roughly 80% of onward transmission, but it is only a rough label and the true split depends on : the smaller , the more skewed the concentration. For the strongly overdispersed case worked below (), the top 20% of cases drive closer to 97% of transmission, well past the nominal 80%. This is the right panel of the figure, a Lorenz-style curve of transmission inequality; the diagonal is the homogeneous limit where every case contributes equally.
Why it changes dynamics and control#
Heterogeneity pulls outbreak dynamics in two directions at once. Introductions are more likely to fizzle, because most index cases infect no one, so a pathogen with a given invades less reliably when is small. But once transmission catches on a superspreading event, growth can be explosive and hard to predict, giving the characteristic pattern of long quiet stretches punctuated by sharp clusters.
For control, concentration is an opportunity. If most transmission flows through a minority of events, then measures that target those settings — reducing large gatherings, ventilating crowded indoor spaces, capping occupancy — buy far more than their share of contact reduction. It also motivates backward contact tracing: given the offspring distribution, a case is more likely to have come from a cluster than from a lone transmitter, so tracing upstream to a common source and then forward from it finds more infections than forward tracing alone. These ideas connect directly to the speed and strength of epidemic control and to stuttering chains at the spillover interface, where small makes early chains flicker in and out before any takes hold.
A worked example#
Take with . We compute the fraction of cases that infect no one, then simulate a large population of cases to measure how much of all transmission comes from the most infectious 20%.
In code#
R#
R0 <- 2; k <- 0.1

p_zero <- (k / (k + R0))^k          # P(no secondary cases)

set.seed(1834)
nu <- rnbinom(1e6, size = k, mu = R0)   # offspring for a million cases
ranked <- sort(nu, decreasing = TRUE)
top20 <- ranked[seq_len(0.20 * length(ranked))]
share_top20 <- sum(top20) / sum(ranked)

c(p_zero = p_zero, share_from_top20 = share_top20)
Python#
import numpy as np
from scipy import stats

R0, k = 2.0, 0.1
p_zero = (k / (k + R0)) ** k

rng = np.random.default_rng(1834)
nu = stats.nbinom.rvs(k, k / (k + R0), size=1_000_000, random_state=rng)
ranked = np.sort(nu)[::-1]
top20 = ranked[: int(0.20 * ranked.size)]
share_top20 = top20.sum() / ranked.sum()

print(f"P(infect no one)          = {p_zero:.3f}")
print(f"share of transmission from top 20% = {share_top20:.3f}")
P(infect no one)          = 0.738
share of transmission from top 20% = 0.969
Julia#
using Distributions, Random, Statistics

R0, k = 2.0, 0.1
p_zero = (k / (k + R0))^k

Random.seed!(1834)
nu = rand(NegativeBinomial(k, k / (k + R0)), 1_000_000)
ranked = sort(nu; rev = true)
top20 = ranked[1:Int(floor(0.20 * length(ranked)))]
share_top20 = sum(top20) / sum(ranked)

(p_zero = p_zero, share_from_top20 = share_top20)
Why it matters#
Reporting only throws away the information that decides how an outbreak feels and how to stop it. The dispersion tells you whether to expect steady spread or rare explosive clusters, whether an introduction is likely to fizzle, and whether control should target settings and clusters rather than the average contact. For emerging and directly transmitted pathogens the answer is almost always that variation dominates, which is why deserves to be quoted alongside rather than buried in the variance.
Related#
- Branching Processes — the offspring distribution and extinction
- The Poisson Distribution — the homogeneous-mixing baseline
- The Next-Generation Matrix and R₀ — averaging transmission across types
- The Effective Reproduction Number and Forecasting
- The Speed and Strength of Epidemic Control
- Pathways to Zoonotic Spillover — stuttering chains at low