Healthcare-Associated Infection Surveillance and the SIR
Healthcare-associated infections — central-line-associated bloodstream infections (CLABSI), catheter-associated urinary tract infections (CAUTI), surgical site infections, and ventilator-associated events — are among the most measured outcomes in modern hospitals, because they are common, harmful, and largely preventable. Comparing them across units or hospitals is harder than it looks: a large intensive care unit with the sickest patients will record more infections than a small step-down ward even if its care is better. The standardized infection ratio (SIR) is the metric built to make that comparison fair, and it is the currency of national surveillance systems such as the CDC’s National Healthcare Safety Network.
Counting infections fairly#
Raw infection counts are not comparable because exposure and risk differ across settings. The first correction is to express infections per unit of device exposure, since the device is the proximate risk: CLABSI is counted against central-line-days, CAUTI against urinary-catheter-days. A rate per thousand device-days is better than a raw count, but it still ignores that patient mix, facility type, and procedure complexity change the baseline risk. Surveillance definitions themselves are standardized down to specifics — which positive cultures count, what counts as line-associated, how the clock starts — so that a CLABSI in one hospital means the same event as in another.
The standardized infection ratio#
The SIR applies indirect standardization, the same logic as a standardized mortality ratio. For each unit you compute the number of infections a national reference population would predict given that unit’s device-days and risk factors, then compare it to what was observed,
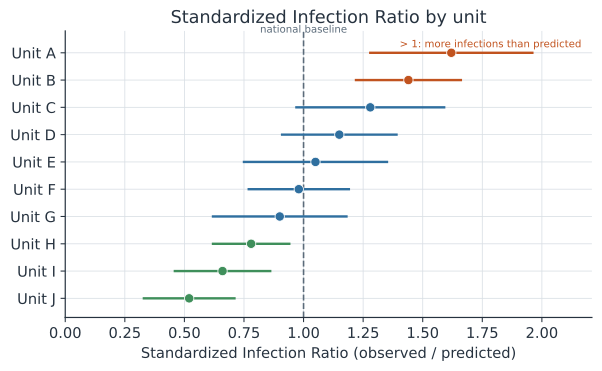
The predicted count comes from risk-adjustment models fit to national baseline data, summing an expected probability across the unit’s exposure. An SIR of 1 means a unit had exactly as many infections as the baseline predicts; above 1 means more than predicted, below 1 means fewer. Because it is a ratio to a risk-adjusted expectation rather than a raw rate, two units with very different patient populations can be placed on the same scale.
Reading an SIR#
An SIR is an estimate, so it comes with uncertainty, and the standard interval treats the observed count as Poisson. A unit is flagged as significantly worse than baseline only when the entire confidence interval lies above 1, and better than baseline only when it lies entirely below — the coloring in the figure. Two cautions matter. The SIR is unstable when the predicted count is small, which is why NHSN suppresses SIRs below a minimum expected number rather than report a ratio built on almost no expected events. And risk adjustment can only correct for measured factors, so a high SIR flags a unit for investigation rather than proving worse care, in the same way a raised aberration-detection alarm opens a question rather than closing it.
A worked example#
A unit observed 12 CLABSIs over a period in which the risk-adjustment model predicted 7.3. We compute the SIR and an exact Poisson 95% confidence interval, treating the observed count as Poisson and dividing its interval by the predicted number.
In code#
R#
observed <- 12; predicted <- 7.3

sir <- observed / predicted
# Exact Poisson (Garwood) limits for the count, divided by predicted.
lower <- qchisq(0.025, 2 * observed) / 2 / predicted
upper <- qchisq(0.975, 2 * (observed + 1)) / 2 / predicted

round(c(SIR = sir, lower = lower, upper = upper), 3)
Python#
from scipy import stats

observed, predicted = 12, 7.3

sir = observed / predicted
# Exact Poisson (Garwood) limits for the count, divided by predicted.
lower = stats.chi2.ppf(0.025, 2 * observed) / 2 / predicted
upper = stats.chi2.ppf(0.975, 2 * (observed + 1)) / 2 / predicted

print(f"SIR = {sir:.3f}")
print(f"95% CI = ({lower:.3f}, {upper:.3f})")
SIR = 1.644
95% CI = (0.849, 2.871)
Julia#
using Distributions

observed, predicted = 12, 7.3

sir = observed / predicted
# Exact Poisson (Garwood) limits for the count, divided by predicted.
lower = quantile(Chisq(2 * observed), 0.025) / 2 / predicted
upper = quantile(Chisq(2 * (observed + 1)), 0.975) / 2 / predicted

(SIR = sir, lower = lower, upper = upper)
The interval includes 1, so despite an SIR of 1.6 this unit is not flagged as significantly worse than the national baseline.
Why it matters#
The SIR is what lets hospital infection prevention be measured, compared, and tied to payment and public reporting, so understanding its construction is understanding how a hospital is judged on safety. Its strength is risk adjustment, which places unlike units on one scale; its limits are that it corrects only for measured risk and grows unstable when expected counts are small. Read as a screening signal rather than a verdict, the SIR points stewardship and infection prevention efforts to the units where the gap between observed and expected is real.
Related#
- Surveillance Systems — the reporting infrastructure behind NHSN
- Measures of Association and Impact — standardized ratios and indirect standardization
- Prospective Outbreak Detection — flagging counts that exceed expectation
- Population Dynamics of Resistance — why HAIs and stewardship are linked