Survey and Questionnaire Design
A survey is a measurement instrument, and like any instrument it can be miscalibrated. Survey sampling decides whom you ask and how to weight them, but the questionnaire decides what you actually measure, and a badly worded question returns the wrong number even from a perfect probability sample. This page is about designing the instrument: writing items people can answer honestly and consistently, reusing questions that others have already validated, and knowing the biases that pull self-reports away from the truth.
Write simple, validated items#
The first rule is plainness. Use short, concrete words at a low reading level, name a specific reference period rather than a vague frequency, and ask about one thing at a time. “How many days in the last 7 did you take your medication?” is answerable; “Do you usually adhere to your treatment?” asks the respondent to define “usually” and “adhere” for you. Every extra clause, abstraction, or piece of jargon widens the gap between what you meant and what different respondents understood.
Prefer items that have already been validated over ones you invent. A validated item comes with evidence that it is reliable (it gives consistent answers) and valid (it measures the construct it claims to), and reusing it buys comparability with other studies for free. Reliability of a multi-item scale is often summarized by Cronbach’s alpha, and the individual items are screened by their item-total correlation — how strongly each item moves with the rest of the scale. A well-behaved item correlates with its siblings; an item that does not is measuring something else, which is exactly the failure the next section describes.
Avoid double-barreled and leading questions#
A double-barreled question asks two things but allows one answer, so the response is uninterpretable. “Is the clinic clean and welcoming?” cannot be answered by someone who found it spotless but cold, and whatever they choose, you cannot tell which half they meant. The fix is always the same: split it into two items, one per construct.
The same discipline rules out a family of wording faults that quietly steer the answer.
| Fault | Bad item | Fixed |
|---|---|---|
| Double-barreled | “Was the staff friendly and prompt?” | Two items: friendliness; promptness |
| Leading / loaded | “How helpful was our excellent new hotline?” | “How helpful, if at all, was the hotline?” |
| Presupposition | “How often do you skip your pills?” | First ask whether they take pills at all |
| Double negative | “Do you disagree that care should not be free?” | State the proposition plainly, once |
| Unbalanced scale | good / very good / excellent | A scale symmetric around a neutral midpoint |
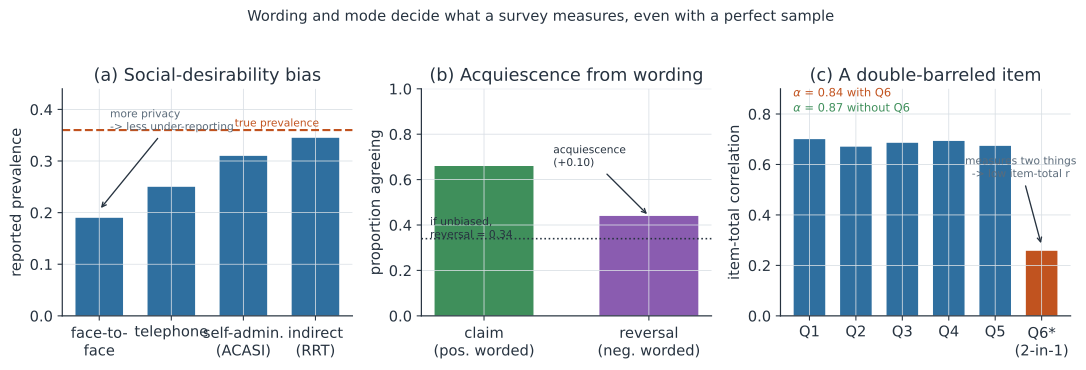
A double-barreled item also shows up quantitatively: because it loads on two constructs, its item-total correlation is low, and keeping it in a scale can lower the reliability of the whole instrument (panel c). That is a useful diagnostic — if one item’s item-total correlation is far below the others, suspect that it is secretly asking about something else.
Reuse instruments that already exist#
You rarely need to write a questionnaire from scratch. Standardized, validated, and often translated instruments exist for most surveillance and household-survey needs, and starting from one saves piloting effort and makes your numbers comparable to everyone else’s.
- The CDC National Hypothesis Generating Questionnaire, described in the CDC Field Epidemiology Manual, is a standardized exposure questionnaire for foodborne and waterborne outbreaks, built because those transmission routes are well enough understood to ask about directly.
- The WHO Outbreak Toolkit publishes standardized case-investigation forms and line-list templates for outbreak response.
- USDA-FSIS Directive 8080.3 shows how a regulatory agency standardizes foodborne-illness exposure and traceback data collection.
- WHO STEPS (risk-factor surveillance), DHS (Demographic and Health Surveys), UNICEF MICS (Multiple Indicator Cluster Surveys), and the CDC BRFSS question modules provide reference household and risk-factor questionnaires; KAP (knowledge, attitudes, practices) templates and SMART and EPI cluster-survey tools cover rapid outbreak and coverage surveys.
When you adapt an existing instrument to a new setting or language, follow the standard workflow — translation, then independent back-translation, reconciliation, cognitive pretesting with real respondents, and a pilot — plus cultural adaptation of examples and categories. Skipping the back-translation or the cognitive pretest is how a validated item quietly becomes an invalid one in the field.
Know the response biases#
Even a well-worded item is answered by a person with reasons to shade the truth, and the predictable ways they do so are named biases with known mitigations.
- Social-desirability bias — respondents under-report stigmatized behaviors and over-report approved ones. Give them privacy: self-administered or audio computer-assisted modes, and indirect techniques such as randomized response, recover more of the truth (panel a).
- Courtesy / acquiescence bias — the tendency to agree, or to please the interviewer. Balance the scale with positively- and negatively-keyed items and train interviewers to stay neutral; the excess agreement to a claim and its reversal is the signature of yea-saying (panel b).
- Confirmation bias — this one is the designer’s. Writing items that can only confirm a prior belief bakes the conclusion into the instrument; neutral, open phrasing and pretesting guard against it.
- Recall bias and telescoping — memory fades and compresses time, so distant events are misdated into the reference window. Use short, anchored reference periods and memory aids.
- Interviewer effects — who asks, and how, shifts the answer. Standardize training and, for sensitive topics, remove the interviewer with self-administration.
- Selection and non-response bias — the people you fail to reach differ from those you do. This is where the questionnaire hands off to the sampling design, whose weighting and imputation adjust for who is missing.
Whom and where you sample#
Wording is only half of instrument design; the other half is where the sample comes from, and it carries its own bias. Much surveillance data is opportunistic rather than drawn by a probability design, so the number of positives in a place reflects where someone happened to sample as much as where disease actually is, and a raw prevalence map is distorted in space and time. Risk-based (targeted) surveillance deliberately aims effort where risk is expected to be highest, and adaptive surveillance updates that targeting as data arrive, as set out for the human-animal interface by Pepin et al., 2021, Preventive Veterinary Medicine. The figure shows the same true risk surface seen through each design: opportunistic sampling that follows access rather than risk over-samples an easy-to-reach strip and misses a hotspot, risk-based sampling covers both hotspots, and adaptive sampling concentrates a second round where the first found signal.
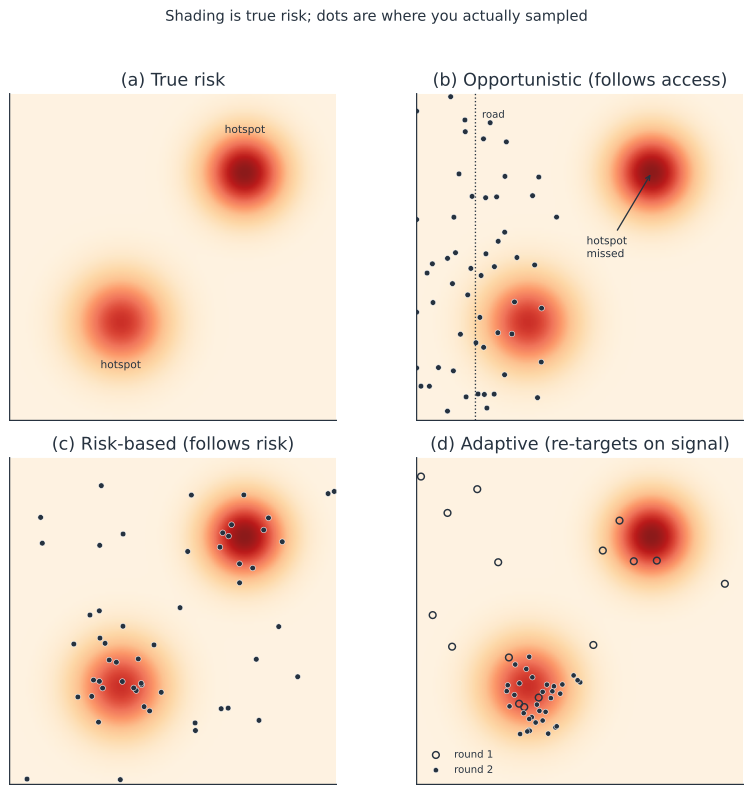
Reading a survey result therefore means asking not just whether the questions were good but whether the sampling frame could see what it claimed to measure — a point developed further in surveillance systems and One Health surveillance.
A worked example#
Suppose a household survey wants to measure attitudes toward a new clinic on a six-item scale. Five items each ask about one facet — trust in staff, travel cost, waiting time, cleanliness, and clarity of information — and a sixth accidentally double-barrels, “Is the clinic affordable and close to home?” Because that item loads on two different constructs (cost and distance), it correlates weakly with the rest of the scale, and dropping it raises the scale’s Cronbach’s alpha rather than lowering it, the opposite of what deleting a good item would do. The item analysis below flags exactly that item, which is the quantitative counterpart to reading the questionnaire and noticing the word “and.”
In code#
We simulate responses to a five-item attitude scale plus one double-barreled item, then compute the item-total correlations and Cronbach’s alpha that flag it. The R and Julia versions mirror the Python.
R#
set.seed(717)
n <- 600; k <- 6
theta <- rnorm(n)                                  # the attitude to measure
phi   <- rnorm(n)                                  # an unrelated construct
clean <- sapply(1:(k - 1), function(i) theta + rnorm(n, 0, 0.85))
barreled <- 0.25 * theta + 0.65 * phi + rnorm(n, 0, 0.9)   # a 2-in-1 item
items <- cbind(clean, barreled)

cronbach_alpha <- function(x) {
  m <- ncol(x)
  (m / (m - 1)) * (1 - sum(apply(x, 2, var)) / var(rowSums(x)))
}

itc <- sapply(1:k, function(j) cor(items[, j], rowSums(items[, -j])))
round(itc, 2)                                      # Q6 stands out as low
c(with_Q6 = cronbach_alpha(items),
  without_Q6 = cronbach_alpha(items[, 1:(k - 1)]))
Python#
import numpy as np

rng = np.random.default_rng(717)
n, k = 600, 6
theta = rng.normal(size=n)                         # the attitude we want to measure
phi = rng.normal(size=n)                           # an unrelated second construct
clean = np.stack([theta + rng.normal(0, 0.85, n) for _ in range(k - 1)], axis=1)
barreled = 0.25 * theta + 0.65 * phi + rng.normal(0, 0.9, n)   # a 2-in-1 item
items = np.column_stack([clean, barreled])

def cronbach_alpha(x):
    m = x.shape[1]
    return (m / (m - 1)) * (1 - x.var(0, ddof=1).sum() / x.sum(1).var(ddof=1))

# corrected item-total correlation: each item vs the sum of the *other* items
itc = [np.corrcoef(items[:, j], items.sum(1) - items[:, j])[0, 1]
       for j in range(k)]
print("item-total r:", "  ".join(f"Q{j+1}={r:.2f}" for j, r in enumerate(itc)))
print(f"Cronbach's alpha  with Q6 (6 items): {cronbach_alpha(items):.2f}")
print(f"Cronbach's alpha without Q6 (5 items): {cronbach_alpha(items[:, :5]):.2f}")
item-total r: Q1=0.70  Q2=0.67  Q3=0.69  Q4=0.69  Q5=0.67  Q6=0.26
Cronbach's alpha  with Q6 (6 items): 0.84
Cronbach's alpha without Q6 (5 items): 0.87
Julia#
using Random, Statistics
Random.seed!(717)
n, k = 600, 6
theta = randn(n)                                   # the attitude to measure
phi   = randn(n)                                   # an unrelated construct
clean = hcat([theta .+ 0.85 .* randn(n) for _ in 1:(k - 1)]...)
barreled = 0.25 .* theta .+ 0.65 .* phi .+ 0.9 .* randn(n)   # a 2-in-1 item
items = hcat(clean, barreled)

function cronbach_alpha(x)
    m = size(x, 2)
    (m / (m - 1)) * (1 - sum(var(x; dims=1)) / var(sum(x; dims=2)))
end

itc = [cor(items[:, j], vec(sum(items; dims=2)) .- items[:, j]) for j in 1:k]
println("item-total r: ", round.(itc; digits=2))
println("alpha with Q6:    ", round(cronbach_alpha(items); digits=2))
println("alpha without Q6: ", round(cronbach_alpha(items[:, 1:(k - 1)]); digits=2))
Why it matters#
A survey’s credibility rests on two independent things being right: the sample must represent the population, and the instrument must measure what it claims to. The sampling side gets most of the statistical attention, but in practice the wording of items and the mode of administration are where household surveys most often go wrong, because those errors are invisible in the final spreadsheet — the numbers look fine and are simply wrong. Writing simple validated items, splitting double-barreled questions, reusing instruments that others have validated, and designing against known response biases is how you make sure the answer you compute is the answer you meant to ask.