Vaccine Effectiveness and the Test-Negative Design
A randomized trial tells you how well a vaccine works under ideal conditions, but the number that matters for a population is how well it works in routine use, against circulating strains, in people who were never in the trial. Estimating that real-world protection is an observational problem, and its workhorse is the test-negative design, now the default method for monitoring influenza and COVID-19 vaccines. The design is elegant and cheap, but it earns valid answers only when its assumptions hold, so it repays understanding what it controls and what it leaves exposed.
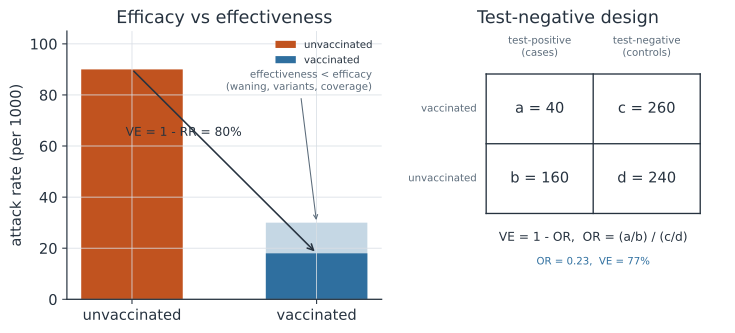
Efficacy versus effectiveness#
Efficacy is the relative reduction in disease measured inside a randomized controlled trial, where randomization balances confounders and the comparison is clean. Effectiveness is the same relative reduction measured in the real world, where coverage is incomplete, strains drift, immunity wanes, and the people who get vaccinated differ from those who do not. Effectiveness is almost always lower than efficacy, and it is the quantity policy actually depends on.
Both are defined as one minus a measure of relative risk,
so a VE of 80% means the vaccinated had a fifth fewer cases than they would have unvaccinated. When the outcome is estimated from a case-control-style design, the risk ratio is replaced by an odds ratio, and .
The test-negative design#
The test-negative design is a case-control study nested in the stream of people who seek care for a syndrome and get tested. Everyone in the study has the same clinical presentation — say, a medically attended acute respiratory illness — and is tested for the pathogen of interest. Those who test positive are the cases; those who test negative are the controls. Vaccine effectiveness is then
with the counts laid out as in the figure: the vaccinated and unvaccinated among test-positives, the same among test-negatives.
The design’s central trick is that requiring everyone to have sought care and been tested conditions on health-care-seeking behavior. If vaccinated and unvaccinated people differ in how readily they seek care, a conventional case-control study would confound that difference with protection; the test-negative design largely removes it, because both cases and controls cleared the same care-seeking bar (Hollingsworth et al. 2020, doi:10.1111/irv.12786).
What it controls and what it does not#
The test-negative design is not automatically unbiased. It removes differential care-seeking, but it still requires that vaccination not affect the chance of having a test-negative illness, that test sensitivity and specificity be adequate, and that the usual confounders — age, calendar time, and season — be adjusted for. A directed acyclic graph is the cleanest way to see which adjustments matter; analyses of large influenza networks find that adjusting for age, sex, and calendar time captures most of the confounding, with comorbidity adjustment mattering only at the margins (Stuurman et al. 2022, doi:10.1111/irv.13087). Misclassification of infection by an imperfect test biases VE toward the null, and selection into testing can reintroduce bias if vaccination changes who gets tested. These are the questions to interrogate before believing any test-negative estimate, in the same spirit as reading a study design for its biases before its result.
Vaccine safety and the self-controlled case series#
Effectiveness answers whether a vaccine prevents disease; safety asks whether it causes rare adverse events, and it needs a different tool. The self-controlled case series uses only people who experienced the event and compares the rate of the event in a defined risk window after vaccination against the rate in control periods for the same person (Farrington 1995). Because each case serves as its own control, every fixed confounder — genetics, chronic conditions, the stable part of health-care access — cancels exactly, leaving only time-varying factors like age and season to adjust for. It is the standard design behind post-licensure signal evaluation, and it pairs naturally with the survival and hazard machinery used to model event times.
A worked example#
From the test-negative table in the figure, take vaccinated and unvaccinated among test-positive cases, and vaccinated and unvaccinated among test-negative controls. We compute the odds ratio and the implied effectiveness.
In code#
R#
a <- 40; b <- 160; c <- 260; d <- 240   # vacc/unvacc x test+ / test-

odds_ratio <- (a / b) / (c / d)
ve <- 1 - odds_ratio

c(odds_ratio = odds_ratio, VE = ve)
Python#
a, b, c, d = 40, 160, 260, 240   # vacc/unvacc x test-positive/test-negative

odds_ratio = (a / b) / (c / d)
ve = 1 - odds_ratio

print(f"odds ratio            = {odds_ratio:.3f}")
print(f"vaccine effectiveness = {ve:.1%}")
odds ratio            = 0.231
vaccine effectiveness = 76.9%
Julia#
a, b, c, d = 40, 160, 260, 240   # vacc/unvacc x test-positive/test-negative

odds_ratio = (a / b) / (c / d)
ve = 1 - odds_ratio

(odds_ratio = odds_ratio, VE = ve)
Why it matters#
Vaccine policy runs on effectiveness estimates produced in near-real time, and the test-negative design is what makes them affordable at the scale of a flu season or a pandemic booster campaign. Knowing that effectiveness sits below efficacy, that the design buys its validity by conditioning on care-seeking, and that an imperfect test drags estimates toward the null lets you read a VE report for the biases that could move it. Safety monitoring runs on a parallel track, where the self-controlled case series turns each affected person into their own comparison and cancels the confounders an ordinary cohort would struggle with.
Related#
- Epidemiologic Study Designs — where the test-negative design sits among case-control methods
- Measures of Association and Impact — risk ratios, odds ratios, and VE
- Causal Inference — confounding, DAGs, and adjustment
- Logistic Regression — adjusting the odds ratio for confounders
- Surveillance Systems — the sentinel networks that feed VE estimates