Density-Dependent and Frequency-Dependent Transmission
The rate at which new infections appear is a product of how many infectious individuals there are and how often a susceptible meets one. That second piece — the contact rate — is where two classic assumptions part ways: does an individual meet more others as the population gets denser, or does it keep a roughly fixed number of contacts no matter how crowded things get? The answer decides whether a pathogen faces a critical host density below which it cannot spread, and it changes what control does.
One transmission term, two contact rules#
Write new infections per unit time as a per-capita contact rate , a per-contact transmission probability , and the chance a contact is with an infectious individual, : Everything hinges on how the contact rate depends on the total host density .
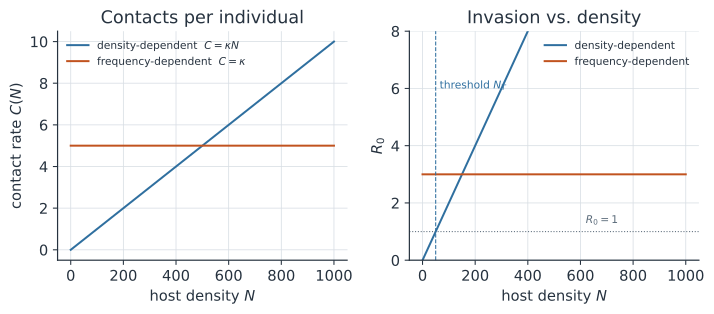
Density-dependent transmission assumes contacts scale with density, . Twice as many hosts in the same area means twice as many encounters per individual. Substituting collapses the term to the mass-action form where the transmission constant is often just written . This is the assumption baked into the classic SIR model when it is written with .
Frequency-dependent transmission (also called standard incidence) assumes the contact rate is fixed, , independent of density. Each individual makes about the same number of contacts whether the population is sparse or dense. The term becomes which is the form.
The two models look almost identical — they differ only by a factor of — but that factor changes the biology completely.
The critical difference: a density threshold#
Consider a pathogen invading a fully susceptible population, so . It spreads when , i.e. when the basic reproduction number .
Under density dependence, seeding one infection into gives , so This scales with density. Setting gives a critical host density below which the pathogen cannot invade no matter how it is introduced. Thinning the host population below eradicates the disease — the logic behind culling and behind the local fadeout of measles in small communities before vaccination.
Under frequency dependence, the cancels: independent of population size. There is no density threshold. A sexually transmitted infection can persist in a small, sparse population just as well as a large one, because partners are acquired at a rate set by behavior, not by crowding.
Show how β and R₀ change with population size
Both models are the same equation with a different transmission coefficient. Write new infections in the standard-incidence form and let a single coefficient absorb the contact rule. The two assumptions are then just two shapes for that coefficient:
Under density dependence the coefficient grows linearly with crowding; under frequency dependence it is flat. The power-law compromise interpolates the two as .
Seed one infection into a fully susceptible population, . The infected class then obeys
so the basic reproduction number is , giving
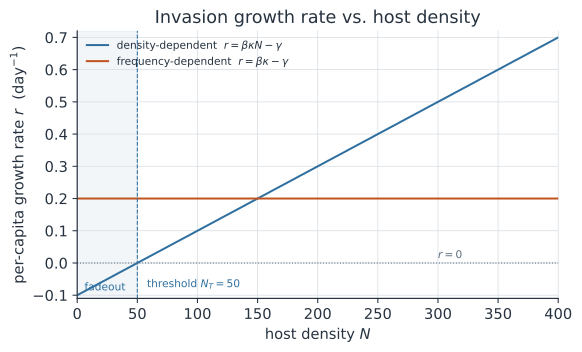
The density-dependent carries a factor of ; the frequency-dependent one does not. The invasion (per-capita) growth rate is , so it shares the sign of :
The density-dependent rate is a rising line that crosses zero exactly at the critical density — below it the pathogen shrinks, above it it grows — while the frequency-dependent rate is a horizontal line whose sign never depends on .
Which assumption fits which disease#
The right choice is an empirical question about how contact scales, not a mathematical preference.
- Density-dependent fits many directly transmitted diseases where crowding raises encounter rates: airborne and fecal-oral infections in wildlife and livestock, phocine distemper in seals, many plant pathogens.
- Frequency-dependent fits sexually transmitted infections (partner acquisition is behavioral), vector-borne diseases (the biting rate is set by the vector, not host density), and social-contact diseases in populations that regulate group size.
Real systems often sit between the two, and a common compromise is the power law with : recovers density dependence, recovers frequency dependence. Fitting to contact or incidence data is a standard way to let the data decide (McCallum, Barlow & Hone 2001).
A worked example#
Take a recovery rate (a 10-day infectious period) and compare two population sizes, and .
For a density-dependent pathogen with per individual, the threshold is hosts. So is at and at — the same pathogen barely spreads in the small population and explodes in the large one.
For a frequency-dependent pathogen with , in both populations. Halving or doubling the host density does nothing to invasion.
Watching the threshold in an SIR epidemic#
The invasion algebra becomes vivid when we run the full SIR model forward. Keep and the two transmission constants from above, seed one infection, and compare population sizes and .
A density-dependent epidemic uses the mass-action term :
so climbs from at to at .
A frequency-dependent epidemic divides the same term by :
so at both sizes.
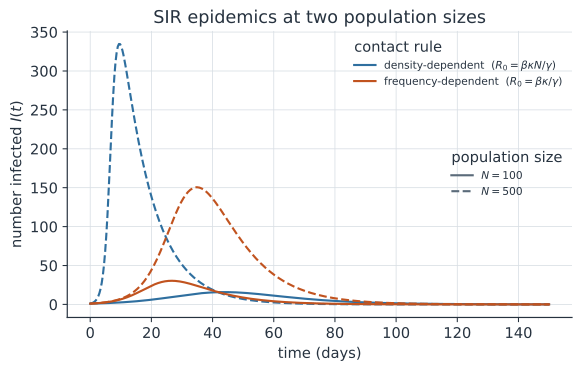
Colour marks the contact rule and dashing marks the population size, so each curve is one row of the earlier table playing out in time. The two frequency-dependent curves (orange) are the same epidemic: both have , so they share a growth rate and reach the same fraction of the population — raising from 100 to 500 just scales the count up about fivefold (a single seed is a smaller starting fraction in the larger population, so its wave arrives a little later). The two density-dependent curves (blue) are different epidemics: at the pathogen barely spreads (, a slow bump peaking near 16), while at it explodes (, a fast wave peaking above 330). Raising the density changes what kind of outbreak happens under density dependence, but only how large it is under frequency dependence.
In code#
We compute under both assumptions at two densities to see the density dependence appear and disappear.
R#
gamma <- 0.1

# density-dependent: R0 scales with N, threshold at N_T
bk_dd <- 0.002
R0_dd <- function(N) bk_dd * N / gamma
N_T <- gamma / bk_dd                 # critical host density = 50

# frequency-dependent: R0 independent of N
bk_fd <- 0.3
R0_fd <- function(N) bk_fd / gamma

sapply(c(100, 1000), R0_dd)          # 2 and 20
sapply(c(100, 1000), R0_fd)          # 3 and 3
N_T                                  # 50
Python#
gamma = 0.1
bk_dd, bk_fd = 0.002, 0.3

R0_dd = lambda N: bk_dd * N / gamma          # scales with density
R0_fd = lambda N: bk_fd / gamma              # flat in density
N_T = gamma / bk_dd                          # critical host density

print("density-dependent R0:", [round(R0_dd(N), 2) for N in (100, 1000)])
print("frequency-dependent R0:", [round(R0_fd(N), 2) for N in (100, 1000)])
print("critical host density N_T:", N_T)
density-dependent R0: [2.0, 20.0]
frequency-dependent R0: [3.0, 3.0]
critical host density N_T: 50.0
Julia#
gamma = 0.1
bk_dd, bk_fd = 0.002, 0.3

R0_dd(N) = bk_dd * N / gamma      # scales with density
R0_fd(N) = bk_fd / gamma          # flat in density
N_T = gamma / bk_dd               # critical host density = 50

R0_dd.((100, 1000))               # (2.0, 20.0)
R0_fd.((100, 1000))               # (3.0, 3.0)
Why it matters#
The transmission term is the single most consequential modeling choice in an epidemic model, and it is easy to make by accident: writing versus commits you to a whole theory of how contact works. Get it wrong and the model can predict a density threshold that does not exist, or miss one that does — which in turn misprices interventions like culling, vaccination, and social distancing. The same distinction propagates into calculations via the next-generation matrix, into the vector-borne models where frequency dependence is the norm, and into the evolution of virulence, where how transmission scales with host density shapes the selective pressure on the pathogen.
Related#
- Compartmental Models (SIR) — where the term comes from
- The Next-Generation Matrix and R₀
- Vector-Borne Disease Models — frequency-dependent transmission via biting
- SEIR and Compartmental Extensions
- Exponential and Logistic Growth — density dependence in population growth
- Adaptive Dynamics and the Evolution of Virulence
- Quantitative Methods