Debugging and Troubleshooting
Bugs are normal, not a sign you’re bad at this. What separates a smooth debugging session from a frustrating one is a calm, systematic process. Panic-editing random lines is the slow path; the steps below are the fast one (Figure 1).
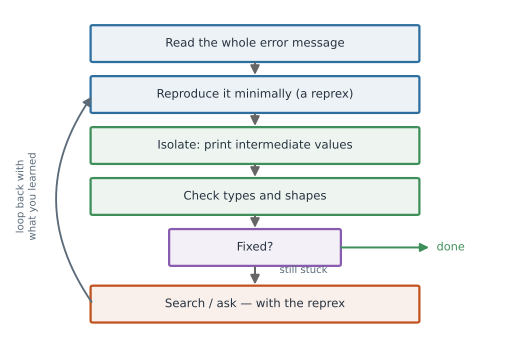
Read the error message#
It sounds obvious, but read the whole message, slowly. It usually names the problem, the function, and the line. Most “mysterious” errors are explained in the text people skip.
Error in log(x) : non-numeric argument to mathematical function
That is telling you x isn’t numeric.
Believe it, and go check the type of x.
Reproduce it minimally (a reprex)#
Strip the problem down to the smallest snippet that still fails. Doing so often reveals the cause on its own, and it’s exactly what you’ll need if you ask for help. This minimal, self-contained example is a reproducible example, or reprex.
# A good reprex: self-contained, runs on its own, shows the error
x <- c("1", "2", "3")   # oops, character not numeric
mean(x)
#> Error in mean.default(x): argument is not numeric or logical
R’s reprex package renders a snippet with its output so you can paste a faithful copy anywhere:
reprex::reprex({
  x <- c("1", "2", "3")
  mean(x)
})
Isolate with print and interactive tools#
Find where reality diverges from your expectation by looking at intermediate values.
- Quick and universal: print things.
print()/cat()in R,print()in Python,@showin Julia. - Pause and poke around live:
browser()(R),breakpoint()/pdb(Python),Debugger.jl(Julia).
# @show-style tracing in R
f <- function(v) {
  cat("class(v):", class(v), "\n")   # inspect before it blows up
  mean(v)
}
def f(v):
    breakpoint()          # drops into pdb here; type `v`, `n`, `c`
    return sum(v) / len(v)
f(v) = (@show typeof(v); sum(v) / length(v))
Check assumptions: types and shapes#
A huge share of bugs are a value that isn’t what you assumed — a string where you expected a number, a length-0 vector, a matrix transposed, an NA sneaking through.
str(x)          # structure, type, first values
length(x); dim(m); anyNA(x)
print(type(x), np.shape(x), np.isnan(x).any())
@show typeof(x) size(m) any(isnan, x)
Rubber-duck it#
Explain the code out loud, line by line, to a rubber duck (or a patient colleague). Forcing yourself to state what each line should do surfaces the line that doesn’t.
Search effectively#
- Paste the exact error text into your search engine (drop the parts specific to your data, like file paths).
- Prefer the official documentation first (
?functionin R,help()in Python,?functionin Julia), then Stack Overflow. - On Stack Overflow, read the accepted answer and the comments; check the question actually matches yours.
When and how to ask for help#
Ask once you’ve read the error, made a reprex, and checked types — that work often solves it, and if not, it makes your question answerable. A good help request includes:
- What you’re trying to do (the goal, not just the broken line).
- A minimal reproducible example anyone can run.
- The full error message.
- What you expected vs. what happened, and what you already tried.
- Your environment (
sessionInfo()/ versions).
This is the spirit of Jenny Bryan’s What They Forgot to Teach You About R: a self-contained reprex plus a clean environment respects the helper’s time and, more often than not, hands you the answer while you build it.
A worked example#
# BAD: fails, and it's not obvious why at a glance
rates <- read.csv("rates.csv")$rate   # comes in as "0.3","0.5",...
adjusted <- rates * 100
#> Error: non-numeric argument to binary operator
Diagnose it:
str(rates)
#>  chr [1:200] "0.3" "0.5" ...     # <- the culprit: character, not numeric
Fix it:
rates <- as.numeric(read.csv("rates.csv")$rate)
adjusted <- rates * 100