Vectorial Capacity from Field Data
How much malaria transmission can a mosquito population sustain? The Ross–Macdonald theory answers with vectorial capacity — the number of infectious bites that will eventually arise from all the mosquitoes biting a single infectious person on one day — but the theory is only as good as the entomological indices fed into it. This page is about the measurement side: turning field collections (landing catches, dissections, ELISA plates) into biting rates, survival, and infection rates, and propagating their uncertainty into a capacity estimate.
The entomological indices#
Field transmission is quantified through a handful of measurable quantities:
- Human biting rate — bites per person per night, from human landing catches or calibrated traps. ( is mosquitoes per person, the per-mosquito rate of biting humans.)
- Sporozoite rate — the fraction of mosquitoes carrying infectious sporozoites, from salivary-gland dissection or a circumsporozoite ELISA/PCR — a proportion with a binomial confidence interval.
- Entomological inoculation rate — infectious bites per person per unit time, the standard field measure of transmission intensity, usually annualized.
- Daily survival probability — inferred from parity (the fraction of females that have laid eggs): with a gonotrophic cycle of days, , and mean adult lifespan is .
- Extrinsic incubation period — days for the pathogen to become transmissible inside the mosquito.
Vectorial capacity#
Assembling these gives the classic expression
Each piece has a meaning: because the mosquito must bite twice (once to acquire, once to transmit); is the probability of surviving the incubation period; is the expected remaining infectious lifespan. Vectorial capacity is the entomological ceiling on the basic reproduction number — once you fold in the transmission efficiencies and human recovery rate .
Survival is the dominant lever#
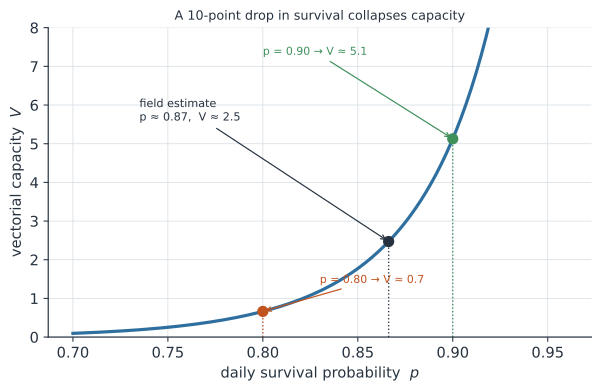
Equation (1) is far more sensitive to some inputs than others. It scales with the square of the biting rate and, through , extremely steeply with survival: because is around – days, a mosquito that dies a day or two sooner is very unlikely to ever become infectious (Figure 1). This is the quantitative reason adult-killing interventions — insecticide-treated nets, indoor residual spraying — outperform larval control: shaving a few points off daily survival cuts capacity far more than halving mosquito numbers. It is also why insecticide resistance, which restores survival, is so damaging: it pushes the population back up the steep part of the curve.
A worked example#
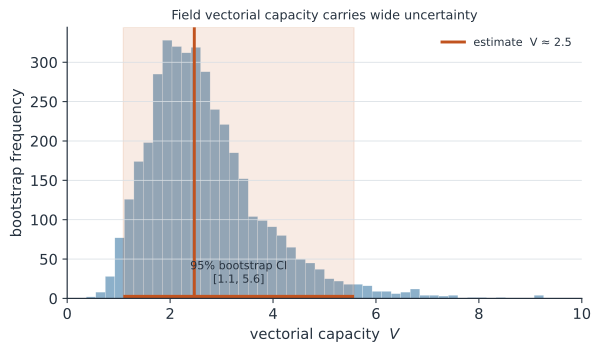
From a season of collections — landing catches, dissected for parity, tested for sporozoites — we estimate the indices, compute the EIR and vectorial capacity, and bootstrap the uncertainty (Figure 2).
import numpy as np

rng = np.random.default_rng(11)
hlc = rng.poisson(6, size=80)              # bites/person/night over 80 person-nights
g, hbi, n_eip = 3.0, 0.9, 11               # gonotrophic cycle, human blood index, EIP
parous, n_dissect = 78, 120                # parity dissections
sporo_pos, n_sporo = 15, 500               # sporozoite ELISA

hbr = hlc.mean()                           # human biting rate ma
a = hbi / g                                # biting rate on humans per day
p = (parous / n_dissect) ** (1 / g)        # daily survival from parity
s = sporo_pos / n_sporo                    # sporozoite rate
eir = hbr * s * 365                         # annual entomological inoculation rate
V = hbr * a * p**n_eip / (-np.log(p))       # since m*a^2 = (ma)*a = hbr*a

# bootstrap the field sampling error into V
def one():
    hb = rng.choice(hlc, len(hlc), replace=True).mean()
    pf = rng.binomial(n_dissect, parous / n_dissect) / n_dissect
    return hb * a * (pf ** (1 / g)) ** n_eip / (-np.log(pf ** (1 / g)))
boot = np.array([one() for _ in range(4000)])

print(f"biting rate {hbr:.1f}/night, survival p={p:.3f}, sporozoite {s*100:.1f}%")
print(f"annual EIR = {eir:.0f} infectious bites/person/year")
print(f"vectorial capacity V = {V:.2f}  "
      f"(95% CI {np.percentile(boot,2.5):.1f}-{np.percentile(boot,97.5):.1f})")
biting rate 5.7/night, survival p=0.866, sporozoite 3.0%
annual EIR = 63 infectious bites/person/year
vectorial capacity V = 2.47  (95% CI 1.1-5.6)
The headline numbers — an EIR near and a vectorial capacity around — describe intense transmission, but the wide bootstrap interval is the honest part: field entomology is noisy, and a capacity “estimate” with no uncertainty is not one.
In code#
R#
# entomological indices are simple arithmetic; the value is in propagating error
p <- (parous / n_dissect)^(1 / g)               # daily survival
V <- hbr * (hbi / g) * p^n_eip / (-log(p))
# boot::boot() over the landing-catch and dissection data for a CI on V and EIR
Julia#
p = (parous / n_dissect)^(1 / g)
V = hbr * (hbi / g) * p^n_eip / (-log(p))
# resample hlc and redraw parity/sporozoite counts to bootstrap the interval
Why it matters#
The entomological inoculation rate is the field gold standard for malaria transmission intensity — the number every control programme wants to drive toward zero — and vectorial capacity is the mechanistic quantity that says which lever moves it most. Because capacity hinges on mosquito survival raised to a large power, it explains why the historically successful vector-control tools all shorten mosquito life, and why measuring insecticide resistance matters: an intervention only lowers capacity if it still actually kills. Reporting these indices with their uncertainty, rather than as point values, is what keeps an entomological risk assessment honest.