Publication Bias and Small-Study Effects
A meta-analysis can only pool the studies it can find, and the studies it can find are a biased sample of the studies that were run. Trials with striking, significant, positive results get published, publicized, and cited; small studies that came up null quietly never appear. The synthesized literature therefore over-represents positive findings, and a naive pooled estimate is inflated — the problem of publication bias, a leading example of the broader small-study effects that make small and large studies disagree.
The funnel plot#
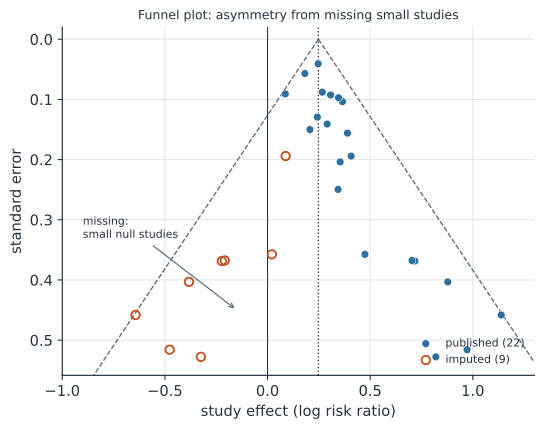
Plot each study’s effect against its precision (usually the standard error, with precise studies at the top). Large studies estimate the effect tightly and sit near the top in a narrow band; small studies scatter widely at the bottom. If nothing is missing, the cloud is a symmetric funnel centered on the true effect. Publication bias breaks the symmetry: the small studies that would have landed in the bottom corner nearest the null are the ones most likely suppressed, leaving a gap (Figure 1).
Funnel asymmetry is not proof of publication bias. Genuine heterogeneity (small studies done in higher-risk populations), worse methodology in small studies, or chance can all bend a funnel. “Small-study effects” is the honest, agnostic name for what the plot detects.
Egger’s test#
To put a number on the asymmetry, Egger’s regression test regresses each study’s standardized effect (the effect over its standard error) on its precision (the inverse standard error); a non-zero intercept means small and large studies give systematically different effects — funnel asymmetry. It is the workhorse test, but it is underpowered with few studies and can be fooled by heterogeneity, so it needs studies and is a screen, not a verdict.
Trim-and-fill#
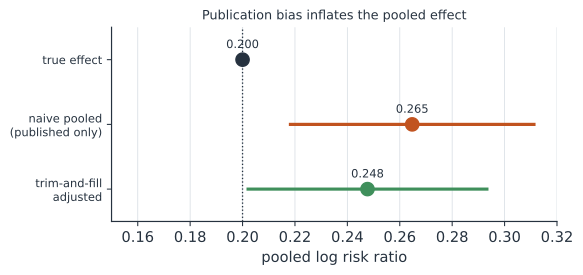
Trim-and-fill turns the funnel into an adjustment: it estimates how many studies are missing from the sparse side, imputes their mirror images on the other side, and recomputes the pooled estimate from the completed funnel (Figure 2). Treat it as a sensitivity analysis — “how much could the estimate move if the plausible missing studies were there?” — not a correction that recovers the truth; it typically under-corrects and rests on the mirror-image assumption.
A worked example#
We simulate 64 studies of a true effect of , publish the precise ones and only the significant small ones, and look for the damage.
import numpy as np
from scipy import stats

rng = np.random.default_rng(3)
m = 64
se = rng.uniform(0.04, 0.6, m)
y = rng.normal(0.20, se)                          # true log risk ratio = 0.20
pub = (se < 0.12) | (y / se > 1.28)               # precise, or small-and-significant
ys, ses = y[pub], se[pub]
v = ses**2
fe = lambda yy, vv: (yy / vv).sum() / (1 / vv).sum()

# Egger's test: standardized effect ~ precision; intercept != 0 means asymmetry
snd, prec = ys / ses, 1 / ses
X = np.column_stack([np.ones(len(ys)), prec])
b = np.linalg.lstsq(X, snd, rcond=None)[0]
resid = snd - X @ b
cov = (resid @ resid / (len(ys) - 2)) * np.linalg.inv(X.T @ X)
egger_p = 2 * stats.t.sf(abs(b[0] / np.sqrt(cov[0, 0])), len(ys) - 2)

# trim-and-fill: estimate the number missing, impute, re-pool
th = fe(ys, v)
for _ in range(30):
    T = ys - th; Sr = np.sum(stats.rankdata(np.abs(T))[T > 0])
    k = len(ys); L0 = max(0, round((4 * Sr - k * (k + 1)) / (2 * k - 1)))
    order = np.argsort(ys)
    th = fe(ys[order[:k - L0]] if L0 else ys, v[order[:k - L0]] if L0 else v)
ex = np.argsort(ys)[k - L0:] if L0 else []
adj = fe(np.r_[ys, 2 * th - ys[ex]], np.r_[v, ses[ex]**2])

print(f"published {len(ys)}/{m}, true 0.20")
print(f"naive pooled {fe(ys, v):.3f}   Egger intercept {b[0]:.2f} (p={egger_p:.3f})")
print(f"trim-and-fill imputed {L0}, adjusted pooled {adj:.3f}")
published 22/64, true 0.20
naive pooled 0.265   Egger intercept 1.39 (p=0.000)
trim-and-fill imputed 9, adjusted pooled 0.248
The published studies alone put the pooled effect well above the truth, Egger’s test flags the asymmetry, and trim-and-fill pulls the estimate back toward — not all the way, but enough to show the naive number should not be trusted at face value.
Beyond funnels#
Funnel-based methods are screens; stronger approaches model the selection directly.
- Selection models posit an explicit publication-probability function of the p-value and estimate the effect that accounts for it.
- PET-PEESE and related regression adjustments extrapolate the effect to a hypothetical infinitely-precise study.
- Prospective registration (trial registries, pre-registration, registered reports) is the only real cure — it makes the unpublished studies findable so they can be included in the first place.
Why it matters#
Meta-analysis is supposed to be the top of the evidence hierarchy, but it inherits every distortion in what got published, and publication bias systematically pushes pooled effects away from the null — exactly the direction that leads to overstated benefits and overconfident guidance. Every serious systematic review therefore inspects a funnel plot, tests for small-study effects, and runs trim-and-fill or a selection model as a sensitivity analysis, reporting how fragile the headline number is to the studies that never appeared. The uncomfortable lesson is that the fix is upstream: only registering studies before they run can make the missing ones visible.