Within-Host Dynamics and the Immune Response
The SIR and SEIR models track a pathogen as it spreads between hosts, but the same compartmental thinking describes what happens inside a single host. Here the compartments are target cells, infected cells, and free virus, and the immune system plays the role that recovery and removal play at the population scale. This page builds the standard within-host model and adds an explicit B-cell (antibody) and T-cell (CTL) response, following Nowak and May.
The target-cell model#
Let be uninfected target cells, infected cells, and free virus. Target cells are produced at rate , die at per-capita rate , and become infected on contact with virus at rate . Infected cells die at rate and shed virus at rate ; free virus is cleared at rate .
This is the exact analogue of the between-host compartmental model: susceptible target cells replace susceptible hosts, and infected cells replace infectious hosts. The uninfected steady state is , and the infection can establish only when the within-host basic reproductive ratio exceeds one.
The interpretation is the same as at the population scale: counts how many new infected cells one infected cell produces, through the burst of virus it releases, in an otherwise uninfected host.
Adding B-cell and T-cell responses#
The immune system removes virus in two complementary ways. Cytotoxic T lymphocytes (CTL) kill infected cells, and antibodies produced by B cells neutralize free virus. We add a CTL compartment that grows in response to infected cells and an antibody compartment that grows in response to virus.
The term is extra killing of infected cells by CTL, and is neutralization of virus by antibody. The effector equations are the same predator-prey logic used elsewhere in ecology: CTL proliferate at rate in proportion to their infected-cell “prey” and decay at rate , while antibody proliferates at rate and decays at rate . This is why within-host immunology and predator-prey dynamics share so much mathematical structure.
Clearance versus persistence#
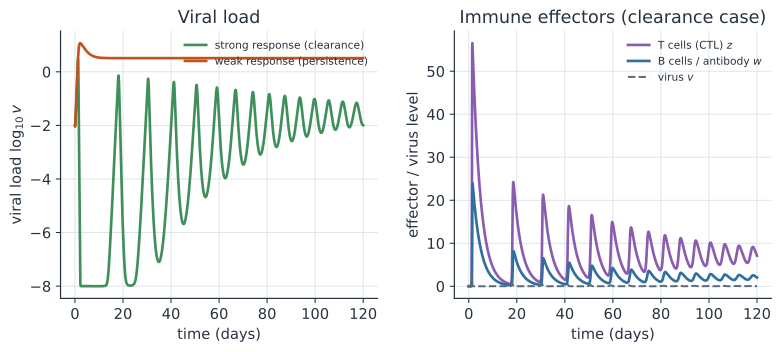
The strength of the adaptive response decides the outcome. When CTL and antibody responses are strong, they drive infected cells and virus down to a low set point, far below the peak — functional clearance. When the adaptive response is weak or absent, the virus is limited only by the supply of target cells and settles at a high, persistent set point, the hallmark of a chronic infection. The figure above contrasts the two regimes for the same virus and the same initial seed, changing only the responsiveness of the effectors.
A worked example#
Take scaled parameters , , , , , . The uninfected target-cell level is , so a vigorous infection. Without an effective adaptive response the virus reaches the target-cell-limited set point . With a strong response the antibody set point and the CTL set point both fall as the effectors grow, pushing viral load down by about two orders of magnitude.
In code#
R#
library(deSolve)

within_host <- function(t, y, p) {
  with(as.list(c(y, p)), {
    dx <- lam - d * x - beta * x * v
    dy <- beta * x * v - a * y - pk * y * z
    dv <- k * y - u * v - q * v * w
    dz <- c * y * z - b * z
    dw <- g * v * w - h * w
    list(c(dx, dy, dv, dz, dw))
  })
}

base <- c(lam = 1, d = 0.1, beta = 1, a = 0.5, k = 5, u = 3,
          pk = 1, q = 1, b = 0.3, h = 0.3)
y0 <- c(x = 10, y = 0, v = 1e-2, z = 1e-3, w = 1e-3)
t  <- seq(0, 200, by = 0.5)

strong <- ode(y0, t, within_host, c(base, c = 10, g = 10))
weak   <- ode(y0, t, within_host, c(base, c = 0,  g = 0))
tail(strong[, "v"], 1)   # low set point (clearance)
tail(weak[, "v"], 1)     # high set point (persistence)
Python#
import numpy as np
from scipy.integrate import solve_ivp

lam, d, beta = 1.0, 0.1, 1.0
a, k, u = 0.5, 5.0, 3.0
p, q, b, h = 1.0, 1.0, 0.3, 0.3

def rhs(t, y, c, g):
    x, yi, v, z, w = y
    return [lam - d*x - beta*x*v,
            beta*x*v - a*yi - p*yi*z,
            k*yi - u*v - q*v*w,
            c*yi*z - b*z,
            g*v*w - h*w]

x0 = lam / d
R0 = beta * k * x0 / (a * u)
y0 = [x0, 0.0, 1e-2, 1e-3, 1e-3]
strong = solve_ivp(rhs, [0, 200], y0, args=(10.0, 10.0),
                   method="BDF", rtol=1e-8, atol=1e-10)   # stiff system: BDF stays stable
weak = solve_ivp(rhs, [0, 200], y0, args=(0.0, 0.0),
                 method="BDF", rtol=1e-8, atol=1e-10)
print(f"within-host R0 = {R0:.1f}")
print(f"strong immunity: set-point v = {strong.y[2][-1]:.3f}")
print(f"no adaptive immunity: set-point v = {weak.y[2][-1]:.3f}")
within-host R0 = 33.3
strong immunity: set-point v = 0.028
no adaptive immunity: set-point v = 3.233
Julia#
using DifferentialEquations

function within_host!(du, y, p, t)
    x, yi, v, z, w = y
    lam, d, beta, a, k, u, pk, q, b, h, c, g = p
    du[1] = lam - d*x - beta*x*v
    du[2] = beta*x*v - a*yi - pk*yi*z
    du[3] = k*yi - u*v - q*v*w
    du[4] = c*yi*z - b*z
    du[5] = g*v*w - h*w
end

y0 = [10.0, 0.0, 1e-2, 1e-3, 1e-3]
strong = solve(ODEProblem(within_host!, y0, (0.0, 200.0),
    (1,0.1,1,0.5,5,3,1,1,0.3,0.3, 10, 10)), Rosenbrock23())
last(strong.u)[3]   # low viral set point (stiff solver)
Why it matters#
Within-host models connect the molecular events of infection to the epidemiology of transmission. The viral load they predict is what a diagnostic qPCR measures, what shapes the infectiousness profile over the course of an infection, and what antiviral therapy tries to suppress. The epidemiology-framed companion page, within-host viral dynamics and infectiousness, follows the same viral-load trajectory forward into when and how much a host transmits. They also set up the multi-scale view that links within-host selection to the between-host evolution of virulence: a virus that replicates fast may reach a high transmissible load but provoke a stronger immune response or kill its host sooner, the same trade-off written one scale down.
Related#
- The SIR Model
- SEIR and Compartmental Extensions
- Predator-Prey Dynamics
- The Evolution of Virulence
- Within-Host Viral Dynamics and Infectiousness — the epidemiology-framed companion linking viral load to transmission
- Quantitative Methods